SUBSEA DATA PROCESSING

Subsea Data Integration & Processing

Turning Raw Survey Acquisition into Actionable Inspection Information

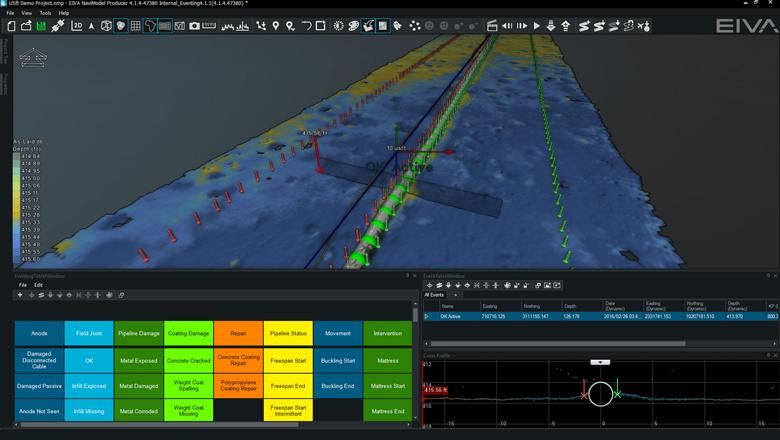
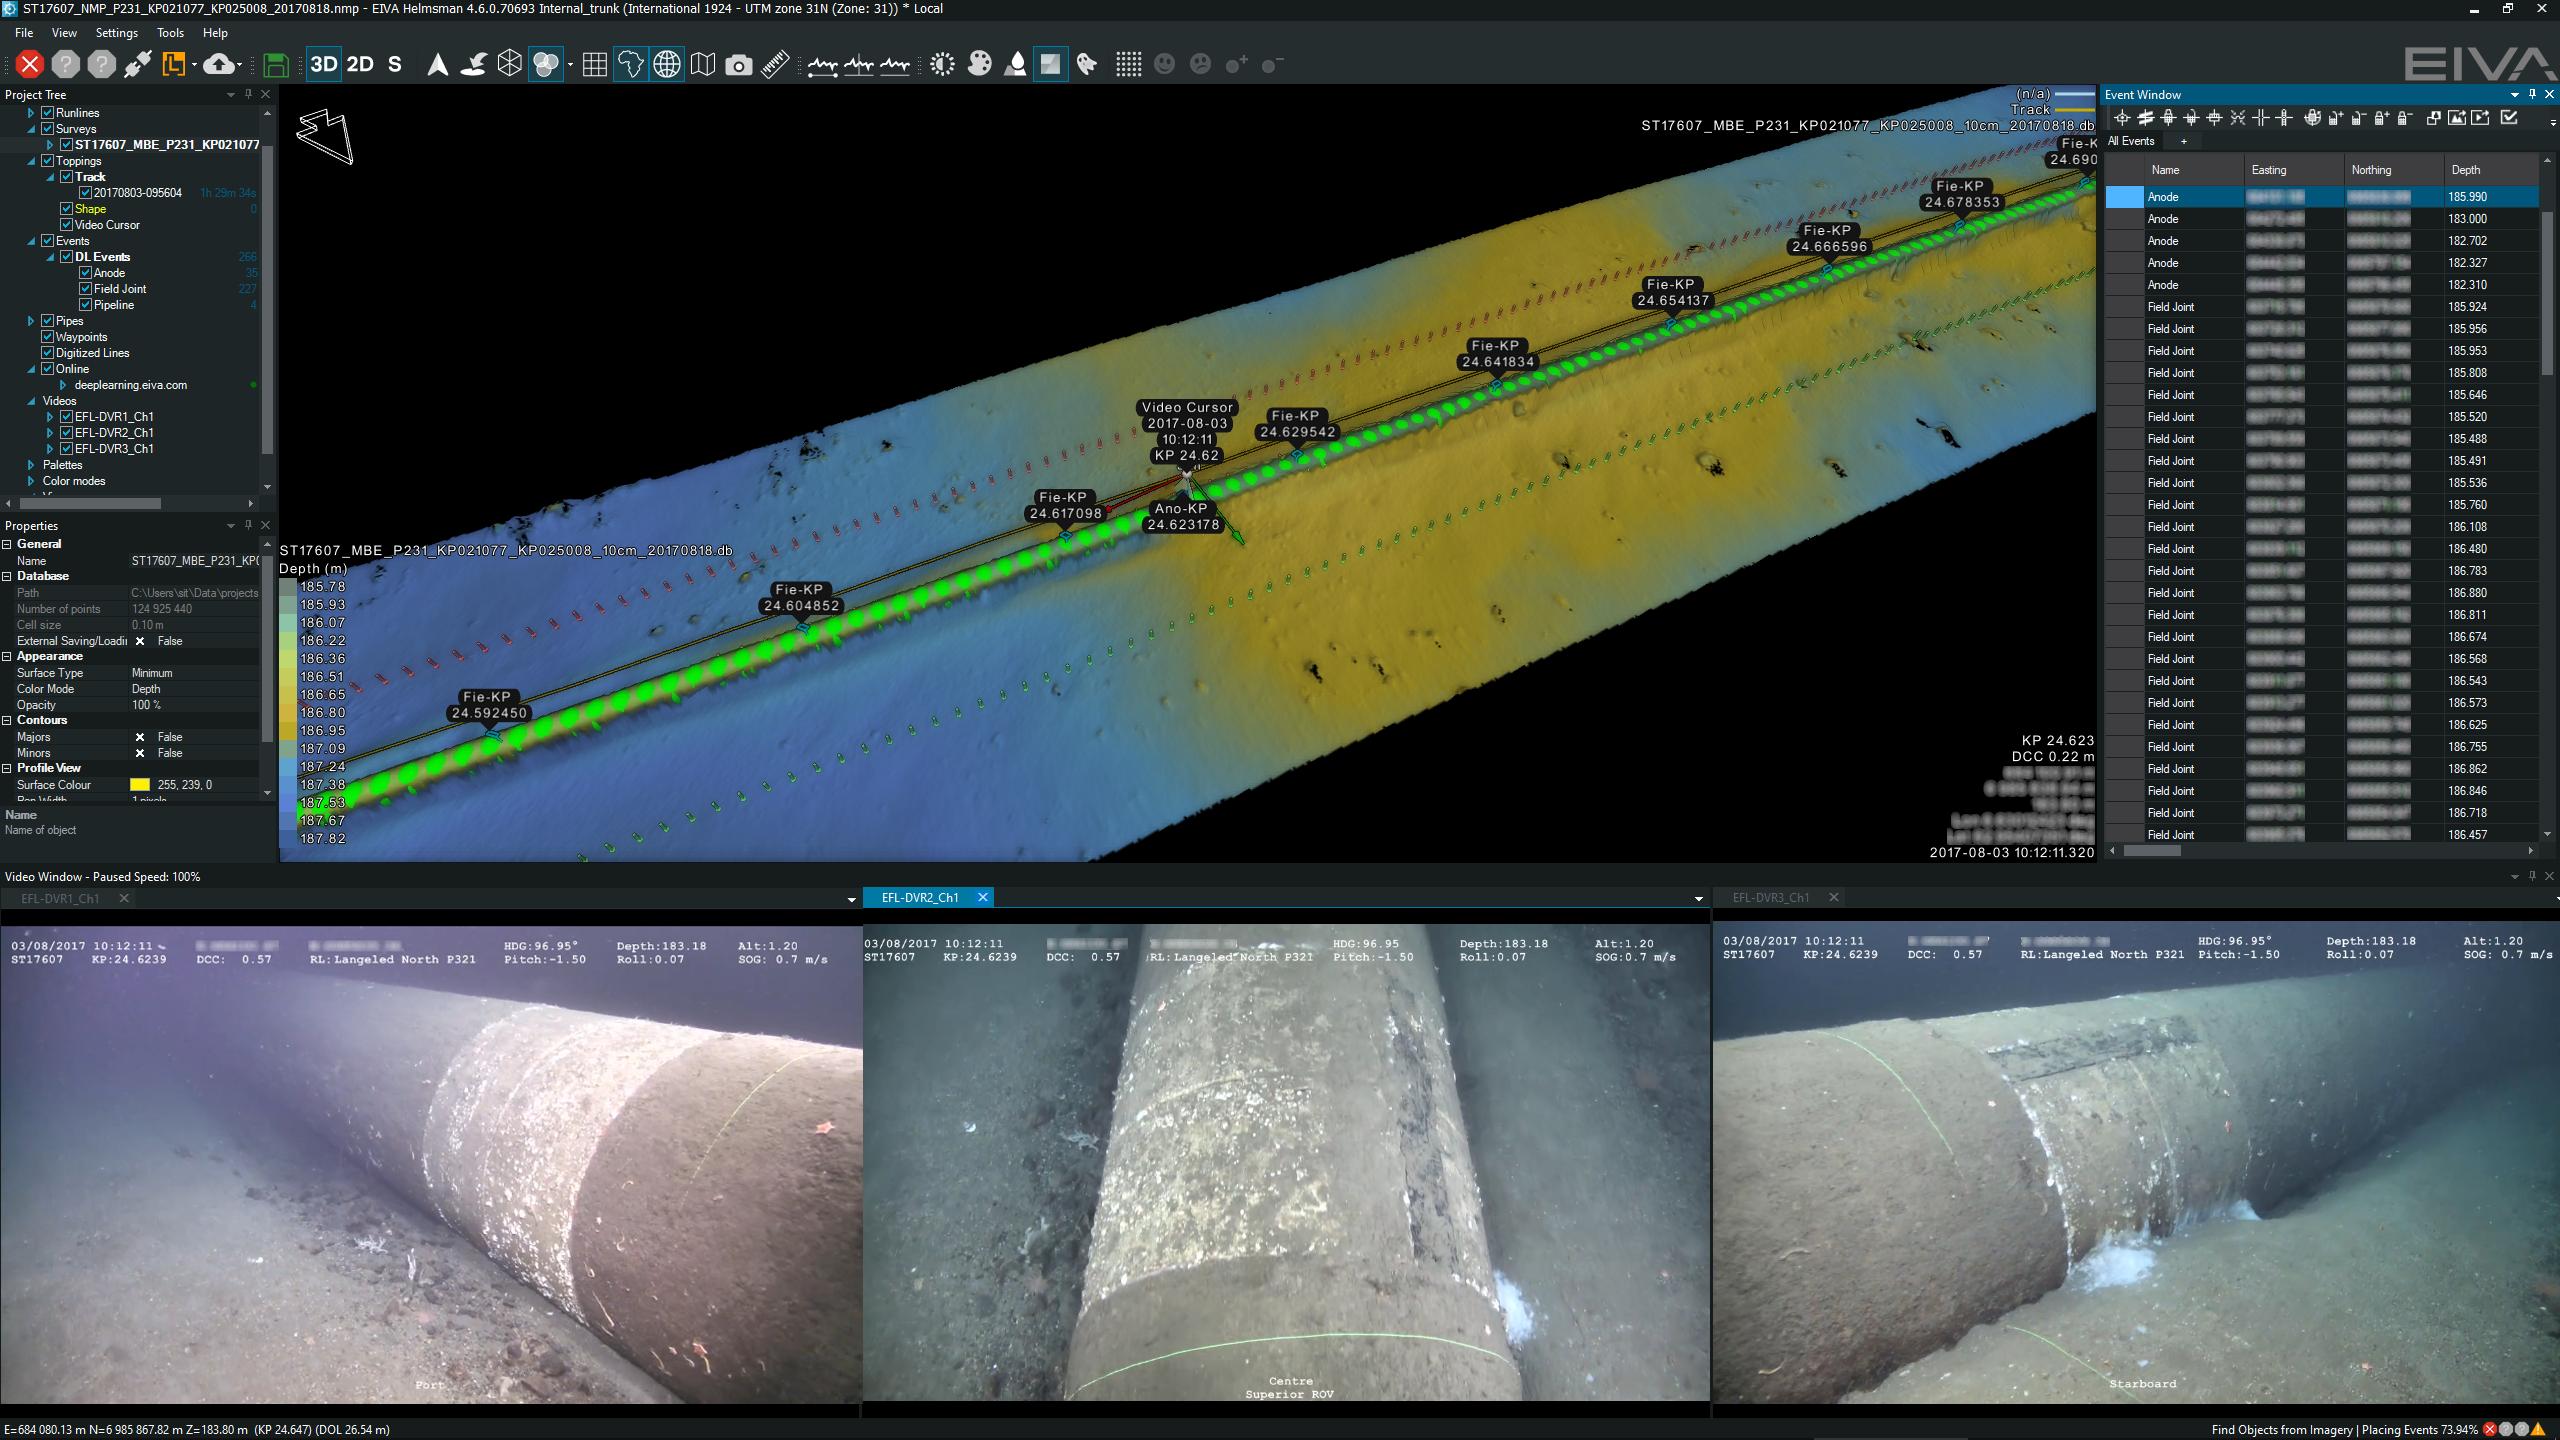
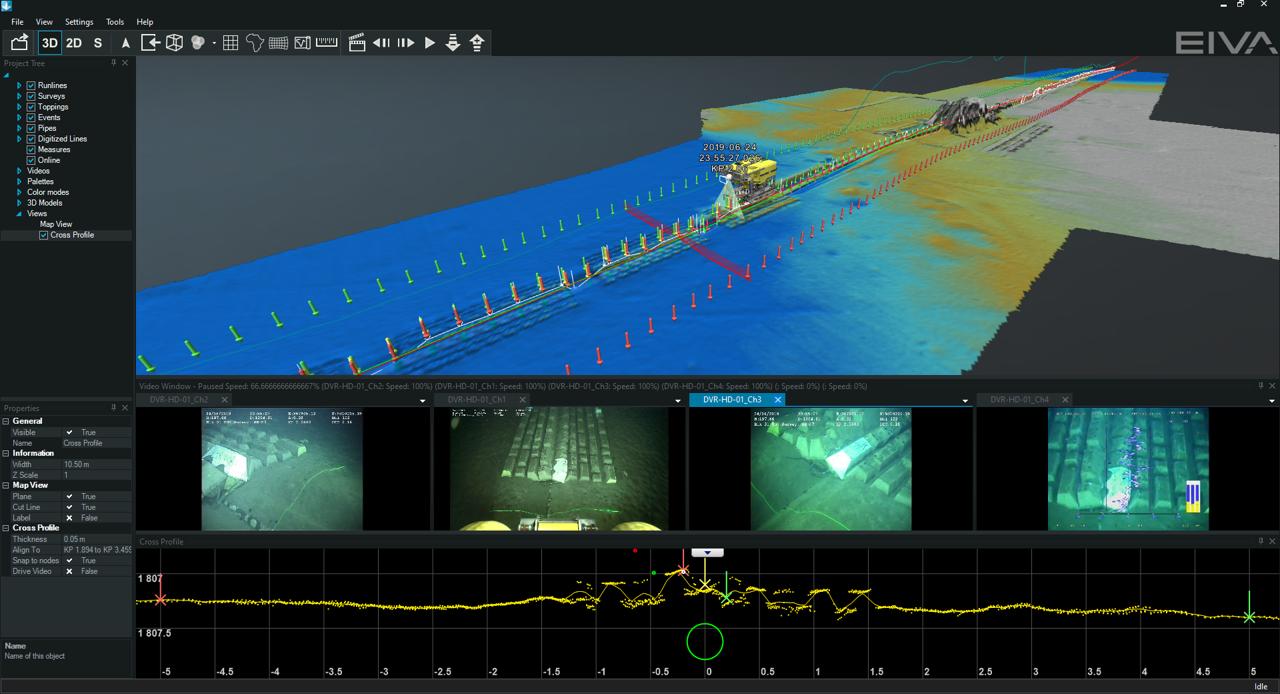
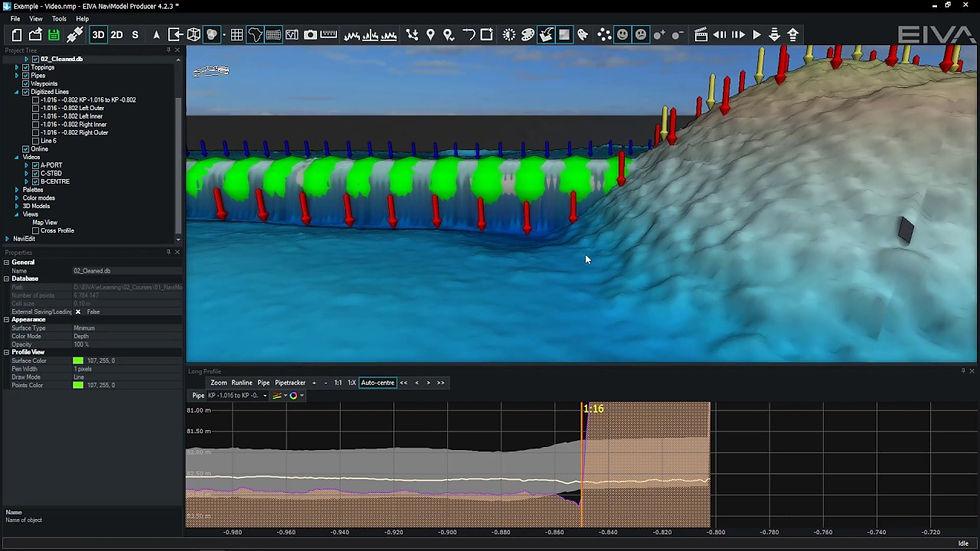
AION uses the EIVA NaviSuite / NaviModel platform to process, quality control, interpret, visualize and report subsea pipeline and cable survey data. The software provides a unified 3D processing environment in which navigation, multibeam, scanning sonar, pipe-tracker, LiDAR, imagery and further inspection sensor data are merged into a single georeferenced project. Working from that combined dataset, pipeline and cable condition, position, burial status, seabed interaction, free spans, crossings and related inspection events can be assessed in detail, supporting final survey deliverables that are both accurate and fully traceable.
Core Processing Capabilities

  • Multi-Sensor Data Integration. Navigation, multibeam, scanning sonar, pipe-tracker, LiDAR, imagery/video and additional inspection datasets are brought together within a single georeferenced 3D environment.
  • Pipeline & Cable Route Processing. Georeferenced survey and inspection data along subsea pipeline and cable routes is processed in support of route surveys, as-built surveys and inspection campaigns.
  • 3D Modelling & Visualization. Pipelines, cables, seabed terrain, structures and their associated inspection data are built into 3D models and presented for review.
  • Digital Terrain Models (DTMs). High-resolution Digital Terrain Models are generated and refined from multibeam and other point-cloud sources.
  • Automated Data Cleaning & Filtering. Advanced cleaning, filtering and calibration routines remove noise and unwanted data while retaining a full audit trail of what has been changed.
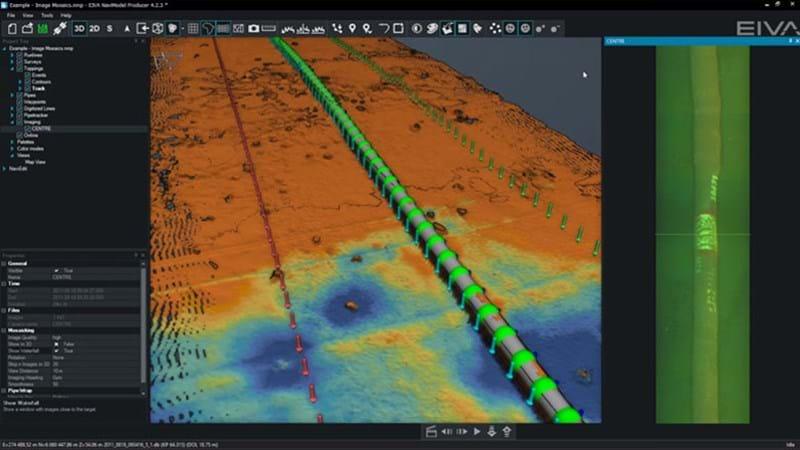
  • Image Processing & Photogrammetry. High-resolution imagery is processed into photo mosaics and dense point-cloud representations of subsea pipelines and assets.
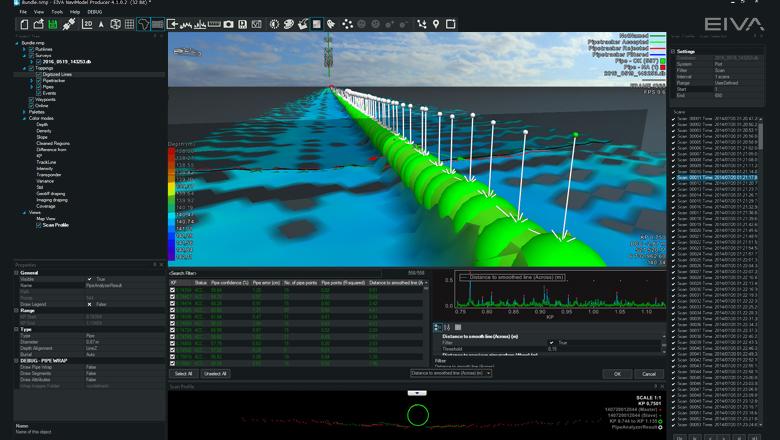
  • Pipeline / Cable Position Detection. Position detection and centreline digitisation are carried out manually or automatically, using georeferenced survey data together with mathematical models.
  • Pipe-Tracker Data Processing. Pipe-tracker information is processed and integrated, with quality filtering, statistical analysis, acceptance/rejection control and 3D visualization.

Data Processing & Workflow Management

Automation Across the Inspection Data Workflow

Automation takes subsea data processing beyond manual interpretation by handling repetitive, data-intensive tasks through structured processing workflows. Engineers and data processors are then free to concentrate on analysis, validation and decision-making rather than routine processing activity, with consistency, efficiency and traceability all improved as a result.

Automated & Intelligent Processing

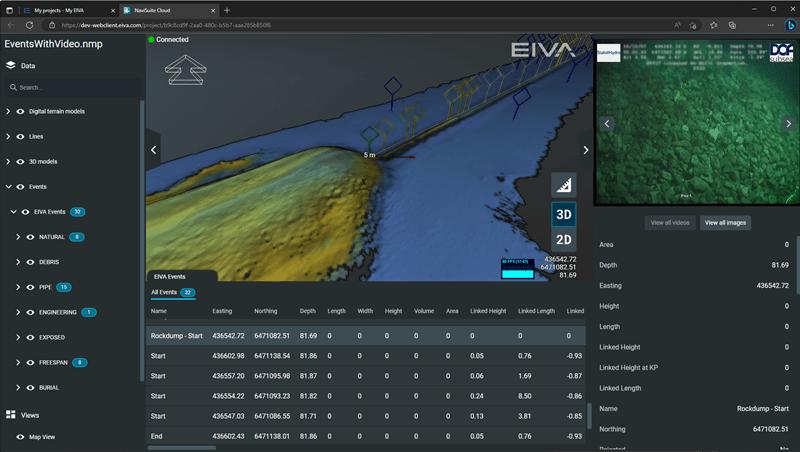
  • Automated Event Detection. Points of interest such as free spans, rocks, boulders and other inspection events are identified and registered automatically.
  • Advanced Data Filtering. Multiple observations are combined with pipe characteristics to produce a more reliable and realistic representation of the pipeline or cable.
  • Scanning Sonar & Scan-Profile Processing. Dual-head scanning sonar and scan-profile data is processed for pipeline, seabed and trench identification.
  • Pipeline / Cable & Seabed Markers. Pipe or cable top, seabed, trench and burial markers are picked along the surveyed route.
  • Free-Span Detection. Free spans are detected automatically from the geometry of the pipeline or cable relative to the seabed.
  • Burial, Exposure & Trench Assessment. Burial depth, exposure and trench condition are assessed along the full length of pipelines and cables.
  • Automated Quality Control. Gaps and inconsistencies in sensor data are flagged early, allowing problems to be resolved before they result in an avoidable re-survey.
  • KP-Based Analysis & Visualization. Inspection results and events are reviewed against chainage / Kilometre Point to support route-based analysis and interpretation.
  • Inspection Event & Anomaly Management. Inspection events and anomalies are identified, classified, positioned and managed across the entire surveyed route.
  • 4D / Change Analysis. Datasets acquired at different times are compared to reveal changes in asset condition, position, seabed development and surrounding infrastructure.

Deliverables, Reporting & Engineering Applications

Integrated Survey Deliverables

Pipeline and cable profiles, events, coordinates, terrain surfaces, images, video clips and inspection results are generated and exported in the required formats.

Repeatable Processing Workflows

Structured, repeatable workflows underpin consistent data, clear traceability and improved reporting quality.

Engineering & Integrity Support

Processed datasets are delivered in a form suited to engineering assessment, integrity management, route surveys, as-built surveys and inspection reporting.

RAW DATA → INTEGRATION → CLEANING & QC → 3D PROCESSING → INTERPRETATION → ANALYSIS → DELIVERABLES